
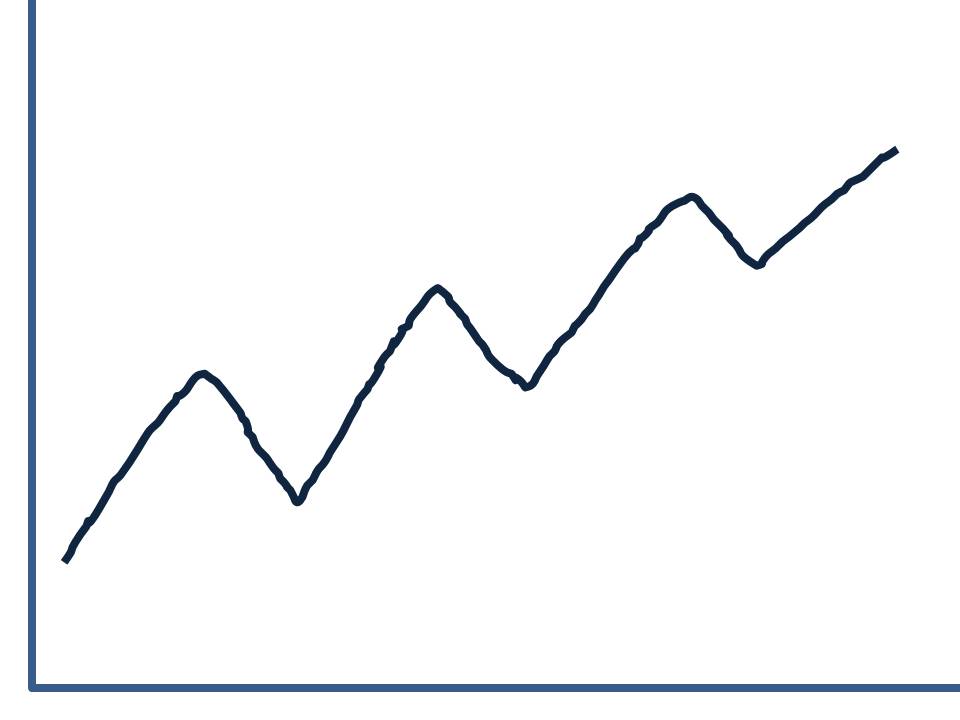
This graph shows a jagged line. This line seems to increase over time, although the progress has many "ups" and "downs." One way to understand the graph is to draw a line which shows the approximate shape of the graph, averaged over time. In the graph below, this approximate line has been drawn in red.

Notice how the red line shows the approximate slope, or trend, of the overall line. This trend line can be used to understand the progress of the variable over time.
Now, consider the following two graphs, excerpted from Fluid Dynamics & The Science of Natural Waterways: Volume 1:


Discussion Questions
- Do these graphs consist of smooth curves or short, connected, straight lines?
- Estimate the data collection rate in these graphs by counting the points of change in a 50-second segment, and dividing by time. What does this information imply?
- Is there a problem with the way data has been collected in this graph?
- Using a visual estimate, determine which graph shows higher water flow overall, as averaged over the entire graph.
- Visually estimate the shape of the first graph, averaging between the high and low points. Describe the shape in words, then draw the averaged line on the graph.
- Visually estimate the shape of the second graph, averaging between the high and low points. Describe the shape in words, then draw the averaged line on the graph.
- Compare and contrast water flow in the two graphs, in a short paragraph.
- Write a hypothesis about the cause of water flow differences in the two graphs.
Additional Information