Schottenbauer Publishing

Saturday, April 30, 2016

Comparing Harmonic Oscillation and Rotation

Graphs of harmonic oscillation and rotation appear very similar when charted on graphs. Harmonic oscillation consists of a mass which moves back and forth in repetitive motion on one axis. Rotation consists of a mass in circular motion around a central point. On a graph, the mass appears to be moving back and forth in repetitive motion on each of two axes.

Consider the following graphs, excerpted from books by Schottenbauer Publishing.


Discussion Questions
  1. Which graphs show harmonic oscillation? 
  2. Which graphs show circular motion?
  3. Describe the relationship between x and y components in circular motion.
  4. Using these graphs, describe at least one similarity between harmonic oscillation and rotation.
  5. Using these graphs, describe at least one difference between harmonic oscillation and rotation.

Over 8,000 graphs from Schottenbauer Publishing provide real-life topics for student learning, including sports, transportation, construction, environment, music, entertainment/toys, and general physics. 

Tuesday, March 22, 2016

Using Graphs in Assessment


As assessment tools, graphs can facilitate the evaluation of both academic and cognitive skills, including higher-order cognitive skills. The most basic test questions using graphs pertain to the concrete skills of reading a graph, while the more advanced and nuanced skills to be tested include those such as writing an equation, selecting graphs to answer a particular problem, comparing and contrasting graphs, and writing a scientific paper. 

The list below identifies ideas for using graphs as assessment tools:

Graph-Reading Skills
  • Identify the variables described in the graph.
  • Identify the minimum and maximum values in the graph.
  • Identify the shape of the graph.

Mathematical Skills
  • Write a mathematical function describing the graph.

Writing Skills
  • Write a meaningful description about a graph.
  • Write a meaningful article about a set of graphs.

Critical Thinking Skills
  • Compare and contrast two graphs.
  • Compare a graph to a known theory.

Concept Formation
  • What principles can be gleaned from a graph or set of graphs?
  • Out of a group of graphs, is there an unexpected outcome? Is this an exception, or an error?


Over 8,000 graphs from Schottenbauer Publishing provide real-life topics for student learning, including sports, transportation, construction, environment, music, entertainment/toys, and general physics. 


Friday, March 11, 2016

Graphs Memorabilia

Celebrate graphs with memorabilia from Zazzle! Colorful graphs from Schottenbauer Publishing are featured on these mugs, magnets, keychains, & postcards. A direct link is included below:

A variety of other STEM education collections are also available from Schottenbauer Publishing on Zazzle, which features regular sales on most items.  


Additional Information


Monday, October 5, 2015

The Origin of Graphs

What is the meaning of the term "origin"? 

According to Dictionary.Reference.com, there are up to eight meanings, two of which are mathematical. The first of these is commonly found in elementary and post-secondary graph-reading skills, while the second (not included here) pertains to more advanced math. 

To answer the above question using the common math definition: Every graph in a Cartesian coordinate system has an origin, which is defined as the intersection of the axes. 

Placement of the origin can dramatically affect the presentation of the graph. Consider the following two graphs, which present the same data, but with different origins.


Discussion Questions
  1. For each graph, identify the following coordinates: (a) Initial Position, (b) Final Position, (c) Minimum Position, and (d) Maximum Position. 
  2. What is the relevance of the origin in each graph (if any)?
  3. Which graph is more useful for visual analysis?
  4. Do any additional differences exist between the graphs? If so, what difference(s) exist?
  5. Do the graphs contain any distortion of data, due to method of collection? If so, what is the distortion? How might the distortion be corrected?

Now, consider a different meaning of "origin." This definition is not mathematical; rather, it refers to "the first stage of existence," or the creation of an entity.

Using this definition, what are the origins of the over 8,000 graphs of sports, transportation, construction, environment, music, entertainment/toys, and general physics from Schottenbauer Publishing

Created by M. Schottenbauer, Ph.D. in laboratory settings, these graphs represent several years of intermittent data collection and graphing activity. The objects studied in the graphs consist of the properties and motion of toys, hobby equipment, household objects, musical instruments, and sports equipment, measured and manipulated by the author. All music and sports activities were conducted by the author, including performance samples on 33 musical instruments and exercises from over 30 sports. Videos of some of these activities are available on YouTube.


Blogs with Free Graphs
  • Sport Science


          Additional Information

          Wednesday, September 9, 2015

          The World in a Graph

          What is more entertaining than learning science and math from the real world? Combining STEM education with fun, The World in a Graph by M. Schottenbauer, Ph.D., is a curiosity piece for educators and students alike. This concise anthology of 28 graphs presents a spectrum of interesting topics from sports, transportation, construction, environment, music, and entertainment. Graph topics, in the same order presented in the book, include:

          • Sports
            • Baseball 
            • Tennis
            • Ice Hockey
            • Snow Skiing
            • Running
            • Walking
            • Biking
            • Weightlifting
            • Gymnastics
            • Track & Field
            • Figure Skating
            • Ballet
          • Transportation
            • Wheels
            • Cars
            • Planes
            • Trains
            • Boats
          • Construction
            • Material Strength Testing
            • Electricity
            • Indoor Lighting
          • Environment
            • Natural Light
            • Natural Water
            • Wind
          • Music
            • Vibration
            • Sound Waves
          • Entertainment
            • A Moving Block
            • A Falling Domino
            • A Rolling Marble

          These topics provide a rich selection of concepts from physical science and physics education, including:


          • General Mechanics 
            • Force 
            • Friction 
            • Material Strength 
            • Collisions 
            • Energy 
            • Momentum 
            • Free-Fall 
            • Projectile Motion 
            • Motion on a Plane 
            • Motion on an Inclined Plane 
            • Rotational Motion 
            • Harmonic Oscillation 
          • Electromagnetism 
            • Electric Potential 
            • Current 
            • Power 
            • Light 
          • Acoustics 
            • Vibration 
            • Sound Waves 
          • Biophysics 
            • Electromyogram (EMG) 
            • Range of Motion or Joint Angles (Goniometer)


          These topics provide a variety of important concepts from math, including the following types of mathematical functions:

          • Math Topics
            • Straight Line
            • Curve
            • Parabola
            • Exponential Function
            • Sinusoidal Function
            • Integral
            • Derivative
            • Damping Function
            • Random Error

          The World in a Graph by M. Schottenbauer, Ph.D. is available from multiple internet retailers, in paperback and Kindle digital editions, as well as wholesale.
          Schottenbauer Publishing offers a wide selection of books, featuring over 8.000 graphs from sports, transportation, construction, environment, music, entertainment, and general physics. Additional information is available on the blog Science and Math Education.


          Additional Information

          Thursday, July 30, 2015

          Graph Lines Up & Down: The Meaning of Change

          Line graphs go up and down. What is the meaning of change? Consider the following three graphs, excerpted from Volumes 1 & 2 of The Science of Home Construction from Schottenbauer Publsihing:


          Discussion Questions
          1. What does the horizontal straight line represent?
          2. Why does the force line go down, and not up?
          3. What does the gradual, curved slope represent?
          4. What does the vertical straight line represent?
          5. What is the maximum force leading to breakage?
          6. Over what time is the force applied?


          Discussion Questions
          1. What does the horizontal straight line represent?
          2. Why do the power and current increase?
          3. What does the first bump represent?
          4. What do the final 2 bumps represent?
          5. Does it take more or less power to remove the screw? Why?
          6. Why is the power to remove the screw not negative?
          7. What is the maximum real power? 
          8. What is the maximum apparent power? 
          9. What is the maximum current?


          Discussion Questions
          1. What physical action is required to make this particular graph? 
          2. What do the three lines represent? 
          3. Why does the angle increase during each rotation event? 
          4. Why does the velocity go down and up during each rotation event? 
          5. Why does the acceleration go down, up, and then down during each rotation event?
          6. How many times is the screwdriver turned?
          7. How many angles is the screwdriver turned each time? Make a list containing the value for each event.
          8. What is the average angle turned by the screwdriver?
          9. What is the total angle turned by the screwdriver?
          10. Over what period of time is the screwdriver turned during each rotation event? Make a list containing the value for each event.
          11. What is the average length of time for a turn of the screwdriver?
          12. What are the minimum and maximum angular velocity values?
          13. What are the minimum and maximum angular acceleration values?

          Over 8,000 graphs from Schottenbauer Publishing provide real-life topics for student learning, including sports, transportation, construction, environment, music, entertainment/toys, and general physics. 


          Additional Information

          Monday, July 27, 2015

          Physics Theory vs. Physical Reality

          The theories of physics consist of neat, clean, mathematical formulas, derived from laboratory conditions. Although these formulas apply to all real life, the data collected from the real world demonstrates much more complexity, resulting in messy graphs.

          Consider the following two neat, simple graphs, taken from simple laboratory experiments:


          Discussion Questions for Each Graph
          1. Describe the graph in words. 
          2. What phenomena is demonstrated? 
          3. What physics theory or theories apply? 
          4. Is the graph consistent with theory?

          Now, consider the two graphs below. These graphs show real-life conditions which are mathematically messy.


          Discussion Questions for Each Graph
          1. Describe the graph in words. 
          2. What phenomena is demonstrated? 
          3. Why is the graph messy? 
          4. How can the graph be analyzed with theories from physics and/or math?

          In elementary and high school classes, emphasis is often on the clean, neat graphs which perfectly illustrate theory. Including messy graphs from real-life conditions can provide a segue into the advanced physics and mathematics topics which are required for working in Science, Technology, Engineering, and Mathematics (STEM) fields as a career scientist.

          Over 8,000 graphs from Schottenbauer Publishing provide real-life topics for student learning, including sports, transportation, construction, environment, music, entertainment/toys, and general physics. 


          Additional Information

          Estimating Averages from Graphs

          Learning to draw visual estimates of averages is an essential graph-reading skill. Consider the graph below:


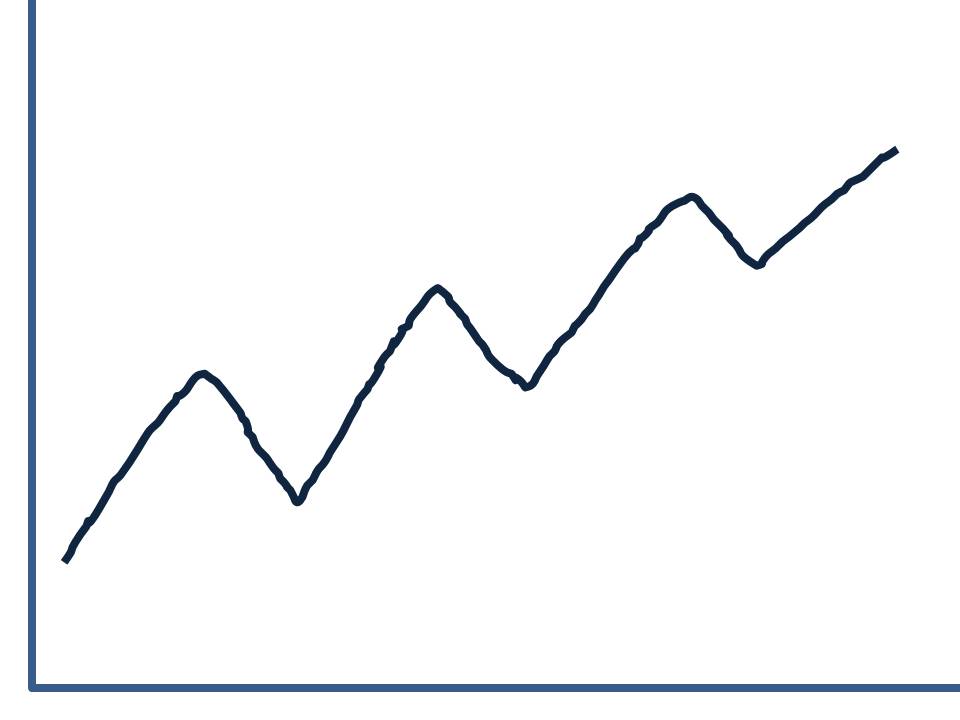
          This graph shows a jagged line. This line seems to increase over time, although the progress has many "ups" and "downs." One way to understand the graph is to draw a line which shows the approximate shape of the graph, averaged over time. In the graph below, this approximate line has been drawn in red.


          Notice how the red line shows the approximate slope, or trend, of the overall line. This trend line can be used to understand the progress of the variable over time.

          Now, consider the following two graphs, excerpted from Fluid Dynamics & The Science of Natural Waterways: Volume 1:


          Discussion Questions
          1. Do these graphs consist of smooth curves or short, connected, straight lines?
          2. Estimate the data collection rate in these graphs by counting the points of change in a 50-second segment, and dividing by time. What does this information imply? 
          3. Is there a problem with the way data has been collected in this graph?
          4. Using a visual estimate, determine which graph shows higher water flow overall, as averaged over the entire graph.
          5. Visually estimate the shape of the first graph, averaging between the high and low points. Describe the shape in words, then draw the averaged line on the graph.
          6. Visually estimate the shape of the second graph, averaging between the high and low points. Describe the shape in words, then draw the averaged line on the graph.
          7. Compare and contrast water flow in the two graphs, in a short paragraph.
          8. Write a hypothesis about the cause of water flow differences in the two graphs.


          Additional Information

          Saturday, July 18, 2015

          Considering Sources of Error in Graphs

          The topic of error is essential when teaching graphs. Error describes inaccurate data, resulting in a graph which does not match the real-life phenomena it intends to measure. Error may occur at one or more points on the graph, which may be found in one or more segments of the graph.

          Graphing errors may occur when the measurement device is not accurate, or when data is not properly recorded. Not all errors may be what they seem, however. Sometimes graphs accurately portray an inaccurate performance. Is it possible to determine the source(s) of error from a graph alone? 

          Consider the following two graphs, excerpted from the book series The Science of Home Construction from Schottenbauer Publishing:


          Discussion Questions
          1. Does either graph contain error? Why or why not?
          2. Does either graph show error due to the measurement device? Why or why not?
          3. In either graph, does the real phenomena provide an unexpected contour? Why or why not?
          4. For either graph, would changing the perspective increase/decrease the apparent error? Why or why not?
          5. Redraw these two graphs, eliminating the likely error(s).

          Schottenbauer Publishing offers over 100 books with graphs of popular topics, including sports, transportation, construction, environment, music, entertainment/toys, and physics. Free samples from these books are featured in the following free blogs, which contain graphs, videos, and discussion questions:


          Blogs with Free Graphs
          • Sport Science


                  Additional Information

                  Sunday, April 26, 2015

                  Upgrading Physical Education with Graphs

                  Physical education classes can easily be upgraded to "high-tech" status by incorporating graphs into lesson plans. As early as fourth grade, students are taught graph-reading skills in math and language classes. These technical skills can easily be applied to physical education topics. 

                  Graphs relevant to physical education include:

                  • Trajectories of Human Motion & Sports Equipment
                    • Position
                    • Velocity
                    • Acceleration
                  • Direct Measurement of Physical Variables
                    • Force
                    • Acceleration
                    • Altitude
                  • Biophysics Data
                    • Joint Angles
                    • Breathing
                    • Heart Rate
                    • Electrical Activity of Heart & Muscles

                  How can these data be used in class? One example is found in the blog article Comparing Graphs of 24 Sports Balls Bouncing, Rolling, & Flying. This article describes how to use a set of three free YouTube videos from Schottenbauer Publishing along with a book of graphs, Bounce, Roll, & Fly: The Science of Balls: Sampler Edition, to compare the performance of 24 popular sports balls.


                  Discussion Questions
                  1. How many times does the baseball bounce?
                  2. From what height is the baseball dropped?
                  3. Write one or more equations describing the motion of the ball.
                  4. What is the potential energy of the baseball in the beginning? At the peak of each bounce? In the end of the graph?
                  5. What is the maximum velocity of the ball? The maximum momentum?

                  Additional sample graphs and discussion questions pertaining to physical education are available on the following free blogs:


                  Over 5,000 sports graphs are available in science lab manuals from Schottenbauer Publishing. Additional information is available on the blog Sport Science Education. Books can be purchased online from AmazonBarnes & NobleBooks-a-Million, and other internet retailers, and wholesale through CreateSpace.

                  Friday, April 24, 2015

                  Using Graphs in Writing Projects

                  The first topics that come to mind when asked about the use of graphs in education are math and science. Perhaps surprisingly, graphs can also be used in language and writing classes, beginning in fourth grade. How can graphs be used in elementary, middle, or high school language classes? The following show several graphs, with examples of literary analyses of the graphs: 

                  Sample Topic 1. A short written response.

                  Sample Question: Describe the following graph in words. 


                  Sample Answer 1: This graph shows the force of hands hitting a drum. Sometimes there is low force (10 N), and sometimes there is high force (100 N). The low force causes a quiet sound, and the high force causes a loud sound. The loudness of sound is not shown in the graph.

                  Sample Answer 2: In this graph, a drummer hits a force plate with bare hands, similar to the surface of a drum. The impact has different level of force, ranging from 10 N to 100 N. The force probably is associated with different types of techniques used, although there is no data provided about technique. The force probably is also associated with dynamic volume and decibel level, although there is no data provided on these variables.


                  Sample Topic 2. Comparison and contrast.

                  Sample Question: Compare and contrast the following two graphs.


                  Sample Answer 1: These graphs shows the sound pressure associated with singing the syllable "ah." The top graph shows a sample two seconds long, and the bottom graph shows a sample 0.03 seconds long. These differences are relevant because the first graph shows a "big picture," and the second graph shows a "close-up." The first graph also shows a sound sample centered on 0, varying approximately 0.1 upwards and downwards on the graph. The second graph shows a sound sample which is not centered; rather, it varies from 0.07 to -0.11 on the graph.

                  Sample Answer 2: The singer's performance was analyzed twice, producing these two samples. The first graph shows a longer sample than the second. In a long sample, it is impossible to see the actual sound wave, because it is blurred together. In the second sample, the wave is clearly shown, but it is very short.


                  Sample Topic 3. Research project.

                  Sample Question: Write a 10-page paper about music.

                  Sample Answer 1 [Process]: The student decides to write a paper about sound waves, and searches through the multi-volume graph books Where Does Sound Come From? and How Do You Play That Thingamabob? The Science of Music Performance, selecting several graphs. The student also searches an encyclopedia and the internet for information about sound waves, sound generation, and microphones. The paper begins with an explanation about the function of sound waves in music, and then provides approximately one graph per paragraph as an example within the paper. Each graph provides a different example of a sound wave. Some examples contrast high and low, loud or soft, and long or short pitches; other examples compare woodwinds, brass, strings, and percussion.  The final result is a 10-page paper plus appendices. Because the project is educational and not for publication, the student makes photocopies of 10 graphs, and attaches these in an appendix to the paper. 


                  Teachers can energize students by allowing them to focus on exciting topics of interest to them. Schottenbauer Publishing features over 8,000 graphs, collected into multi-volume series and anthologies in the following categories:

                  Book Series with Original Graphs

                  Anthologies of 28 Graphs
                  • The World in a Graph
                  • Sports [Multiple Volumes Available]
                  • Transportation
                  • Construction
                  • Music
                  • Play

                  A full listing of graph topics from Schottenbauer Publishing, indexed by book series and data type, are available in a Teacher Resource Guide from the publisher. Free blogs with graphs, discussion questions, and videos are also available from the publisher online.


                  Additional Information

                  Friday, April 10, 2015

                  The Use of Graphs in Open-Ended Projects

                  Traditional classes offer students focused instruction in the use of graphs, including identifying a specific topic area, providing questions which guide graph-reading and analysis, and teaching techniques for identifying equations. Graphs can also be used for open-ended projects, which provide students with more opportunity for choosing their own topics, collecting their own graphs, and synthesizing their own answers in writing. These open-ended projects can be designed for almost any traditional elementary, high school, or college/university class, including math, science, language arts, physical education, music, and art.

                  Graph book series from Schottenbauer Publishing provide ample opportunities for open-ended projects using graphs. These include multi-volume book series on specific topic areas, as well as anthologies of 28 graphs excerpted from these offerings.


                  The following are three examples of open-ended projects using graphs: 

                  Example 1

                  Students in class might be asked to select 2 or 3 volumes of graphs on a topic of their choice, and write a 10-page paper based on a subset of graphs in the books. Students may have a few weeks in which to complete the project, which should include citations from encyclopedias and traditional reference books to support their hypotheses and conclusions. 

                  Example 2

                  During an entrance exam to a private school, students might be asked to use two hours to peruse an anthology of 28 graphs, and write a short essay describing a set of conclusions based on some or all of the graphs in the book. 

                  Example 3

                  A homeschooler might use an anthology of graphs as the basis for a project in which the student identifies equations for the different graphs, and then writes a paper comparing and contrasting mathematical functions across different situations encountered in the natural world.


                  Schottenbauer Publishing features over 8,000 graphs, collected into multi-volume series and anthologies in the following categories:


                  Book Series with Original Graphs

                  Anthologies of 28 Graphs
                  • The World in a Graph
                  • Sports [Multiple Volumes Available]
                  • Transportation
                  • Construction
                  • Music
                  • Play

                  Several sample graphs from Schottenbauer Publishing are shown below:


                  The graphs above demonstrate but a few of the types of data available in science lab manuals from Schottenbauer Publishing.  Examples include:
                  • Physics
                    • Video Analysis
                    • Force
                    • Acceleration
                    • Rotational Motion
                    • Power
                    • Current
                    • Voltage
                    • Light Intensity
                    • Magnetic Field Strength
                    • Temperature
                    • Sound
                    • Sound Level
                    • Air Pressure
                    • Gas Pressure
                    • Wind Speed
                    • Water Flow Rate
                  • Biophysics
                    • Joint Angles
                    • Electromyogram
                    • Electrocardiogram
                    • Blood Pressure
                    • Pulse
                    • Lung Capacity
                    • Breathing Rate

                  A full listing of graph topics from Schottenbauer Publishing, indexed by book series and data type, are available in a Teacher Resource Guide from the publisher. Additional information is also available on the blogs Science and Math Education and Sport Science Education. A list of free blogs with sample graphs, discussion questions, and videos is available in the article Application of Graphs in Education on the blog Graphs in Education.